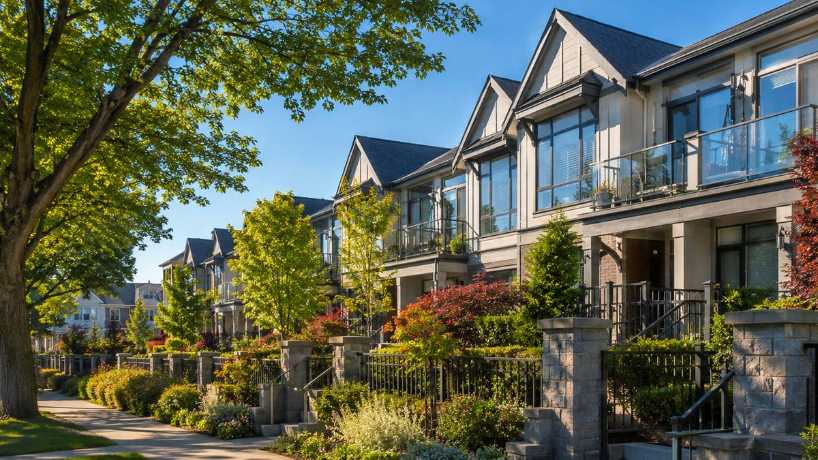
Sundance-Bank Elementary Catchment Market Report

or Create your own market report
Current Sundance-Bank Elementary Catchment Data

Sundance-Bank Elementary Catchment Market Report

Market data for homes listed inside the Sundance-Bank Elementary catchment, which covers Jubilee and the eastern edge of Fernwood in Victoria plus a small corner of north Oak Bay. The figures are generated from current MLS® data and update as homes are listed, sold or repriced.

Catchment market caution: About 40 homes were listed inside the catchment at the start of November 2026, nearly half of them condos, so a few house listings can move the averages sharply. A catchment boundary is also not a guarantee of placement at Sundance-Bank Elementary.
Sundance-Bank Elementary catchment housing market
Sundance-Bank Elementary Catchment Market Jubilee, eastern Fernwood and north Oak Bay
How to Read the Numbers

Understanding Catchment Market Data

Catchment-wide averages blend older condos, brand-new townhomes and century-old houses, so they rarely describe any single home.

01

Condos Outnumber Houses

Condos were the largest group at the start of November 2026, about 19 of 40 listings, mostly one- and two-bedroom units in 1970s to 1990s buildings near Fort Street, Leighton Road and Begbie Street. When several list at once, the catchment average drops even if house values have not moved.

02

New Construction Lifts the Price per Square Foot

Roughly a quarter of the listings were built in 2024 or later, from new condo buildings to new townhomes. New units usually ask more per square foot than resale homes nearby, so a cluster of new listings can raise the price-per-square-foot figure without any change in resale values.

03

Boundaries Are Not a Guarantee

Catchment lines, registration rules and enrolment priorities can change, and the district is still planning a seismic upgrade and expansion of the school. Confirm the current catchment and registration status for any address with School District 61 (Greater Victoria).

04

Active Listings vs. Completed Sales

The statistics describe what sellers are currently asking and how long listings have been on the market. They are not a sold-price index. Valuing a specific home takes recent comparable sales, current competition and adjustments for that home.

Address Beds Baths Living ft2 List Price Cost per ft2 DOM
1521 Belcher Ave Unit ##4 2 3 1,383 $849,000 $613 1 day
1745 Leighton Rd Unit ##213 2 2 933 $439,500 $471 5 days
1710 Fort St Unit ##203 2 2 897 $524,900 $585 5 days
1467 Bay St 2 1 1,152 $719,000 $624 6 days
1746 Pembroke St 3 2 2,005 $1,170,000 $583 6 days
1916 Oak Bay Ave Unit ##210 1 1 568 $649,000 $1,142 7 days
1710 Fort St Unit ##404 1 1 705 $388,000 $550 11 days
1790 Denman St 5 3 3,201 $1,299,000 $405 12 days
2207 Victor St 2 2 1,147 $848,999 $740 17 days
1900 Belmont Ave 4 3 4,054 $2,275,000 $561 18 days
1593 Begbie St Unit ##305 2 2 985 $499,000 $506 19 days
1655 Begbie St Unit ##408 2 1 948 $449,900 $474 19 days
1619 Morrison St Unit ##411 1 1 653 $399,980 $612 24 days
1518 Pandora Ave Unit ##306 2 2 1,035 $495,000 $478 24 days
2022 Foul Bay Rd Unit ##206 2 1 867 $449,900 $518 25 days
1697 Yale St 3 2 1,266 $1,400,000 $1,105 27 days
1610 Jubilee Ave Unit ##205 2 2 1,231 $578,000 $469 31 days
1721 Adanac St Unit ##3 1 1 670 $549,900 $820 32 days
1721 Adanac St Unit ##2 3 3 1,179 $869,900 $737 32 days
1625 Belmont Ave Unit ##303 2 2 1,178 $569,000 $483 32 days
1721 Adanac St Unit ##4 1 1 610 $499,900 $819 33 days
1796 Denman St 1 1 702 $475,000 $676 34 days
1500 Elford St Unit ##303 2 2 1,147 $639,000 $557 34 days
1916 Oak Bay Ave Unit ##406 1 1 545 $619,000 $1,135 34 days
1956 Ashgrove St 4 2 2,577 $1,195,000 $463 42 days
1520 Foul Bay Rd Unit ##7 3 3 1,459 $1,349,000 $924 45 days
1514 Foul Bay Rd Unit ##2 3 3 1,459 $1,399,000 $958 45 days
1704 Coronation Ave 2 3 1,662 $1,295,000 $779 46 days
2235 Shelbourne St Unit ##D 2 1 864 $599,000 $693 47 days
2235 Shelbourne St Unit ##A 3 3 1,707 $858,000 $502 47 days
2235 Shelbourne St Unit ##B 3 3 1,744 $858,000 $491 47 days
2235 Shelbourne St Unit ##C 2 1 864 $625,000 $723 47 days
1637 Pembroke St 3 1 1,700 $749,900 $441 53 days
1745 Leighton Rd Unit ##511 1 1 729 $390,000 $534 54 days
1619 Morrison St Unit ##303 1 1 590 $399,900 $677 55 days
1619 Morrison St Unit ##103 1 1 622 $379,000 $609 58 days
1404 Taunton St 4 1 1,643 $859,000 $522 85 days
1760 Haultain St 4 2 1,804 $949,900 $526 87 days
1745 Leighton Rd Unit ##610 2 2 911 $459,900 $504 88 days
2343 Shelbourne St 4 2 1,974 $860,000 $435 119 days
Average: 2.3 1.8 1,284 $772,036 $636 36 days
Viewing 1 - 40 of 40

How much is your home worth?

...get instant property value now!

NOTE: MLS® property information is provided under copyright© by the Vancouver Island Real Estate Board and Victoria Real Estate Board. The information is from sources deemed reliable, but should not be relied upon without independent verification. This website may only be used by consumers for the purpose of locating and purchasing real estate. By registering on this website I/We consent to the collection, use and disclosure of personal information as described in our privacy policy.
The trademarks MLS®, Multiple Listing Service® and the associated logos are owned by The Canadian Real Estate Association (CREA) and identify the quality of services provided by real estate professionals who are members of CREA. Used under license.