Two Markets in One Catchment
Roughly as many condos as detached houses are listed here, and a typical condo asks about a third of what a typical house does. Catchment averages fall between the two and describe neither very well.


Real Estate Company
Market data for homes listed inside the Sir James Douglas Elementary catchment, which covers western Fairfield from Cook Street to Clover Point and the southern part of Rockland. Figures are generated from current MLS® data and update as homes are listed, sold or repriced.
Search Sir James Douglas catchment homes Fairfield real estate Greater Victoria schools
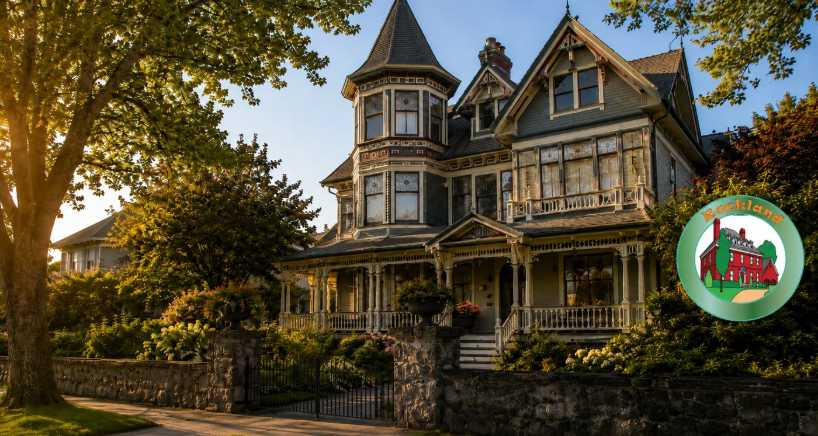
A catchment that runs from older apartments to Rockland estates produces averages that describe the mix, not a typical home.
Roughly as many condos as detached houses are listed here, and a typical condo asks about a third of what a typical house does. Catchment averages fall between the two and describe neither very well.
Large heritage homes in Rockland and new construction in Fairfield sit near the top of the range, while older apartments anchor the bottom. Check property type and age before reading too much into an average.
The district last redrew its elementary catchments for the 2020-21 school year, and lines, enrolment priorities and French Immersion catchments can change again. Confirm the current catchment for a specific address with School District 61 (Greater Victoria).
The statistics describe what sellers are currently asking and how long listings have been on the market. They are not a sold-price index. Valuing a specific home takes recent comparable sales, current competition and adjustments for that home.
| Address | Beds | Baths | Living ft2 | List Price | Cost per ft2 | DOM |
|---|---|---|---|---|---|---|
| 1100 Yates St Unit ##PH1204 | 3 | 3 | 1,367 | $1,699,000 | $1,242 | 3 days |
| 1033 Cook St Unit ##313 | 1 | 1 | 573 | $469,900 | $820 | 4 days |
| 1018 Pentrelew Pl Unit ##207 | 2 | 2 | 807 | $825,000 | $1,022 | 4 days |
| 1421 Richardson St Unit ##1 | 2 | 1 | 603 | $639,000 | $1,059 | 5 days |
| 1562 Richardson St | 4 | 4 | 3,639 | $1,999,000 | $549 | 5 days |
| 123 Cambridge St | 6 | 6 | 3,724 | $2,290,000 | $614 | 7 days |
| 1271 Mckenzie St | 4 | 4 | 2,991 | $1,698,888 | $568 | 10 days |
| 546-548 Linden Ave | 6 | 2 | 2,739 | $1,495,000 | $545 | 11 days |
| 1120 Fairfield Rd Unit ##203 | 2 | 2 | 1,506 | $575,000 | $381 | 11 days |
| 1434 Brooke St Unit ##4 | 3 | 2 | 1,163 | $1,249,999 | $1,074 | 17 days |
| 1434 Brooke St Unit ##2 | 3 | 2 | 1,200 | $1,249,999 | $1,041 | 17 days |
| 129 Moss St | 4 | 4 | 2,215 | $1,525,000 | $688 | 19 days |
| 1100 Yates St Unit ##1010 | 2 | 2 | 961 | $998,000 | $1,038 | 18 days |
| 1545 Pandora Ave Unit ##312 | 2 | 2 | 995 | $399,800 | $401 | 24 days |
| 1217 Fairfield Rd | 3 | 2 | 1,735 | $1,028,000 | $592 | 25 days |
| 1433 Faircliff Lane Unit ##416 | 1 | 1 | 752 | $525,000 | $698 | 25 days |
| 1480 Dallas Rd | 4 | 4 | 2,133 | $1,999,000 | $937 | 29 days |
| 1200 Richardson St Unit ##1 | 2 | 2 | 1,335 | $889,900 | $666 | 27 days |
| 1377 Rockland Ave | 3 | 4 | 3,475 | $1,999,000 | $575 | 32 days |
| 1545 Pandora Ave Unit ##306 | 1 | 1 | 950 | $399,500 | $420 | 34 days |
| 1150 Oxford St | 4 | 4 | 2,728 | $1,995,000 | $731 | 38 days |
| 1540 Dallas Rd Unit ##103 | 2 | 1 | 1,148 | $799,000 | $695 | 40 days |
| 1201 Fort St Unit ##601 | 2 | 3 | 1,630 | $1,789,000 | $1,097 | 45 days |
| 1518 Dallas Rd | 2 | 3 | 2,045 | $1,849,800 | $904 | 46 days |
| 1545 Pandora Ave Unit ##206 | 1 | 1 | 883 | $439,900 | $498 | 46 days |
| 1048 Pentrelew Pl | 3 | 4 | 2,338 | $1,995,000 | $853 | 48 days |
| 1512 Brooke St | 4 | 3 | 2,612 | $1,395,000 | $534 | 48 days |
| 1520 Dallas Rd | 3 | 3 | 2,143 | $1,875,000 | $874 | 48 days |
| 1157 Fairfield Rd Unit ##402 | 2 | 2 | 1,022 | $550,000 | $538 | 49 days |
| 1258 Rockland Ave | 4 | 2 | 1,619 | $1,249,000 | $771 | 53 days |
| 1310 Rockland Ave | 4 | 3 | 2,350 | $1,624,900 | $691 | 54 days |
| 1419 Stadacona Ave Unit ##202 | 1 | 1 | 830 | $409,000 | $492 | 55 days |
| 1217 May St | 2 | 2 | 1,322 | $1,490,000 | $1,127 | 59 days |
| 1277 Revercomb Pl | 4 | 2 | 2,307 | $1,399,900 | $606 | 59 days |
| 1100 Yates St Unit ##606 | 1 | 1 | 484 | $419,000 | $865 | 60 days |
| 336 Stannard Ave | 6 | 3 | 3,547 | $1,600,000 | $451 | 61 days |
| 1121 Fort St Unit ##305 | 1 | 1 | 322 | $315,000 | $978 | 62 days |
| 1145 Hilda St Unit ##401 | 2 | 2 | 1,111 | $514,818 | $463 | 63 days |
| 1145 Hilda St Unit ##101 | 2 | 2 | 1,086 | $549,900 | $506 | 63 days |
| 1144 May St | 5 | 4 | 3,428 | $1,399,900 | $408 | 70 days |
| 1234 Fort St Unit ##201 | 2 | 2 | 1,137 | $525,000 | $461 | 74 days |
| 1419 Stadacona Ave Unit ##207 | 1 | 1 | 810 | $449,000 | $554 | 74 days |
| 1100 Yates St Unit ##303 | 1 | 1 | 475 | $459,900 | $968 | 75 days |
| 1018 Pentrelew Pl Unit ##303 | 1 | 1 | 727 | $749,900 | $1,031 | 76 days |
| 1130 May St | 2 | 2 | 1,144 | $1,049,900 | $917 | 77 days |
| 1130 May St | N/A | N/A | N/A | $1,049,900 | Unknown | 77 days |
| 1155 Yates St Unit ##207 | 1 | 1 | 555 | $419,900 | $756 | 77 days |
| 1121 Fort St Unit ##203 | 1 | 1 | 414 | $377,000 | $910 | 96 days |
| 1033 Cook St Unit ##211 | 1 | 1 | 615 | $525,000 | $853 | 98 days |
| 31 Bushby St | 7 | 3 | 3,544 | $1,899,900 | $536 | 101 days |
| Average: | 3.0 | 2.6 | 1,838 | $1,236,169 | $720 | 62 days |
|
Viewing 1 - 50 of 60
Next
|
NOTE: MLS® property information is provided under copyright© by the Vancouver Island Real Estate Board and Victoria Real Estate Board. The information is from sources deemed reliable, but should not be relied upon without independent verification. This website may only be used by consumers for the purpose of locating and purchasing real estate. By registering on this website I/We consent to the collection, use and disclosure of personal information as described in our privacy policy.
The trademarks MLS®, Multiple Listing Service® and the associated logos are owned by The Canadian Real Estate Association (CREA) and identify the quality of services provided by real estate professionals who are members of CREA. Used under license.