Margaret Jenkins Elementary Catchment Market Report

or Create your own market report
Current Margaret Jenkins Catchment Data

Margaret Jenkins Catchment Market Report

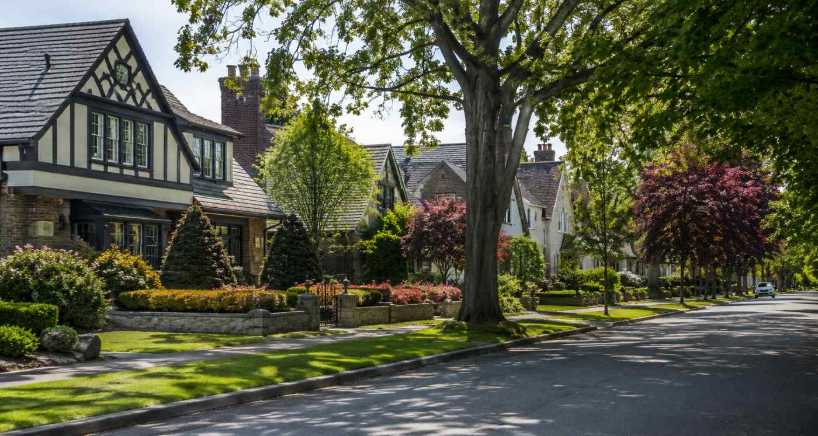
Market data for homes listed inside the Margaret Jenkins Elementary catchment, which covers Fairfield East and eastern Rockland in Victoria and the Gonzales and South Oak Bay areas of Oak Bay. Figures are generated from current MLS® data and update as homes are listed, sold or repriced.

Catchment market caution: Nearly 80 homes were listed inside the catchment at the start of November 2026. One multi-acre land listing at $52.5 million sits far above everything else and inflates the average asking price, so read averages with care. A catchment boundary is not a guarantee of school placement.
Margaret Jenkins catchment housing market
Margaret Jenkins Catchment Market Fairfield East, Rockland, Gonzales and South Oak Bay
How to Read the Numbers

Understanding Catchment Market Data

Because this catchment crosses from Victoria into Oak Bay and runs from condos to multi-million-dollar Oak Bay homes, its averages mix very different properties.

01

Two Municipalities, One School

About half the listings are in the City of Victoria and half in Oak Bay. Property taxes, zoning and municipal services differ on either side of Foul Bay Road, even though both sides share this school and the Oak Bay High pathway.

02

Houses and One Extreme Outlier

Detached houses make up about two-thirds of listings, so the averages mostly describe houses, and a single $52.5 million land listing distorts them further. Look past the average to the individual homes.

03

Boundaries Are Not a Guarantee

Catchment lines, French Immersion catchments and enrolment priorities can change, and this boundary already crosses a municipal line. Confirm the current catchment for a specific address with School District 61 (Greater Victoria).

04

Active Listings vs. Completed Sales

The statistics describe what sellers are currently asking and how long listings have been on the market. They are not a sold-price index. Valuing a specific home takes recent comparable sales, current competition and adjustments for that home.

Address Beds Baths Living ft2 List Price Cost per ft2 DOM
1765 Oak Bay Ave Unit ##105 2 2 917 $699,980 $763 5 days
238 Richmond Ave 3 4 2,839 $1,825,000 $642 1 day
907 Redfern St Unit ##7 3 3 1,330 $1,225,000 $921 5 days
454 Newport Ave 4 4 4,543 $2,899,000 $638 5 days
2018 Romney Rd 4 4 2,945 $2,399,000 $814 6 days
218 Beach Dr 6 3 3,245 $2,199,000 $677 6 days
220 Irving Rd 5 2 2,421 $1,699,000 $701 8 days
1720 Fairfield Rd Unit ##105 2 3 1,047 $844,900 $806 11 days
2464 Hazel St 3 2 1,902 $1,445,000 $759 11 days
373 Richmond Ave 3 1 1,330 $1,199,000 $901 12 days
453 Monterey Ave 4 3 2,144 $2,199,900 $1,026 13 days
1027 Belmont Ave Unit ##7 3 3 2,607 $1,250,000 $479 14 days
1715 Rockland Ave Unit ##5 2 1 905 $649,900 $718 14 days
1568 Montgomery Ave 3 5 4,823 $3,495,000 $724 14 days
430 St. Patrick St 4 6 3,055 $3,399,000 $1,112 14 days
964 Newport Ave 5 4 3,445 $2,890,000 $838 14 days
145 Beechwood Ave 4 2 1,896 $1,195,000 $630 14 days
901 Foul Bay Rd 5 3 2,534 $1,825,000 $720 14 days
50 King George Terr 4 3 3,736 $2,799,800 $749 18 days
1618 Rockland Ave 4 5 3,359 $2,749,000 $818 19 days
318 Newport Ave 3 3 3,226 $3,899,000 $1,208 19 days
2095 Oak Bay Ave Unit ##307 1 1 658 $359,500 $546 19 days
1046 Davie St 3 3 2,513 $1,670,000 $664 20 days
1665 Oak Bay Ave Unit ##401 2 2 1,256 $495,000 $394 20 days
1501 Richmond Ave Unit ##204 2 2 965 $624,900 $647 20 days
335 Beechwood Ave Unit ##202 1 1 758 $675,000 $890 21 days
1200 Hampshire Rd 3 2 1,623 $1,449,000 $892 26 days
261 King George Terr 5 5 6,061 $5,745,000 $947 26 days
667 St. Patrick St 5 2 1,946 $1,250,000 $642 29 days
1240 Victoria Ave 3 3 2,080 $1,599,000 $768 32 days
157 Robertson St 3 3 2,683 $1,999,900 $745 32 days
2118 Pentland Rd Unit ##4 3 4 1,477 $1,295,000 $876 34 days
2095 Oak Bay Ave Unit ##301 2 1 824 $474,000 $575 34 days
1064 Beverley Pl 13 7 6,669 $3,290,000 $493 37 days
2125 Central Ave 5 3 3,134 $2,499,900 $797 36 days
1880 Chandler Ave Unit ##8 3 3 1,680 $1,265,000 $752 39 days
875 Richmond Ave 5 4 4,358 $1,999,000 $458 40 days
909 Redfern St Unit ##3 3 3 1,198 $995,000 $830 40 days
2125 Oak Bay Ave Unit ##407 2 2 1,277 $649,900 $508 40 days
335 Beechwood Ave Unit ##201 3 2 1,246 $1,275,000 $1,023 42 days
30 Beach Dr 4 3 2,372 $3,549,000 $1,496 41 days
1030 St. Charles St 7 10 7,630 $3,249,000 $425 41 days
1059 Clare St 4 4 2,875 $1,624,900 $565 42 days
515 Foul Bay Rd 11 9 8,313 $4,000,000 $481 46 days
907 Redfern St Unit ##10 1 1 517 $550,000 $1,063 49 days
987 Beach Dr 3 3 3,030 $3,250,000 $1,072 50 days
517 Foul Bay Rd Unit ##1 1 1 596 $599,000 $1,005 53 days
521 Foul Bay Rd Unit ##3 3 3 1,419 $1,319,000 $929 53 days
519 Foul Bay Rd Unit ##2 4 4 1,794 $1,675,000 $933 53 days
335 King George Terr 3 3 2,955 $2,288,000 $774 53 days
Average: 3.7 3.3 2,723 $2,799,817 $823 59 days
Viewing 1 - 50 of 77

How much is your home worth?

...get instant property value now!

NOTE: MLS® property information is provided under copyright© by the Vancouver Island Real Estate Board and Victoria Real Estate Board. The information is from sources deemed reliable, but should not be relied upon without independent verification. This website may only be used by consumers for the purpose of locating and purchasing real estate. By registering on this website I/We consent to the collection, use and disclosure of personal information as described in our privacy policy.
The trademarks MLS®, Multiple Listing Service® and the associated logos are owned by The Canadian Real Estate Association (CREA) and identify the quality of services provided by real estate professionals who are members of CREA. Used under license.