Downtown Condos Set the Average
Studio and one-bedroom condos on the north side of downtown make up most of the inventory, which keeps the average price, size and bedroom count low compared with the houses on Fernwood’s side streets.


Real Estate Company
Market data for homes listed inside the George Jay Elementary catchment, which covers north downtown Victoria and Chinatown, North Park and much of Fernwood. Figures are generated from current MLS® data and update as homes are listed, sold or repriced.
Search George Jay catchment homes Downtown Victoria real estate Greater Victoria schools
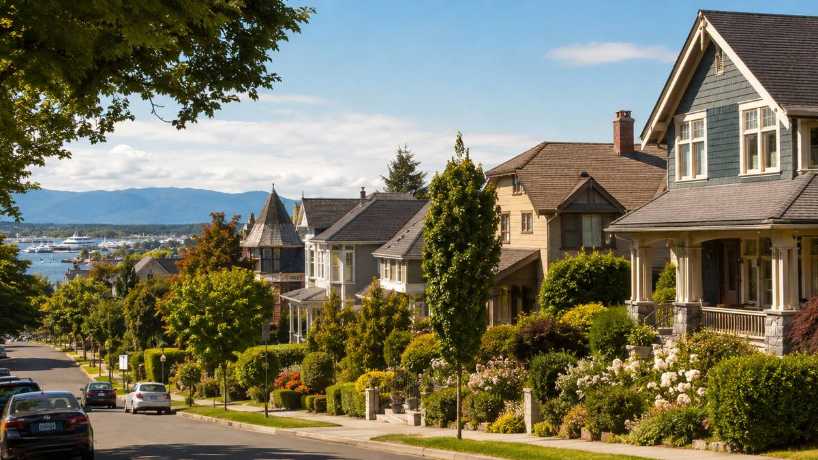
Downtown studios and Fernwood family houses share this catchment, so its averages reflect the mix more than any one kind of home.
Studio and one-bedroom condos on the north side of downtown make up most of the inventory, which keeps the average price, size and bedroom count low compared with the houses on Fernwood’s side streets.
Character houses, duplexes and townhomes in Fernwood and North Park sit in a separate band, mostly between about $560,000 and $1.8 million, so families looking for a ground-level home should filter listings by type.
The George Jay catchment shrank in 2020 when South Park and Bank Street gained catchments of their own, a reminder that lines can move. Confirm the current catchment for a specific address with School District 61 (Greater Victoria).
The statistics describe what sellers are currently asking and how long listings have been on the market. They are not a sold-price index. Valuing a specific home takes recent comparable sales, current competition and adjustments for that home.
| Address | Beds | Baths | Living ft2 | List Price | Cost per ft2 | DOM |
|---|---|---|---|---|---|---|
| 1019 North Park St Unit ##3 | 2 | 2 | 1,057 | $559,900 | $529 | 3 days |
| 1039 Caledonia Ave Unit ##203 | 2 | 1 | 861 | $399,900 | $464 | 3 days |
| 1105 Pandora Ave Unit ##N312 | 2 | 2 | 816 | $674,900 | $827 | 4 days |
| 1090 Johnson St Unit ##409 | 1 | 1 | 713 | $449,900 | $630 | 4 days |
| 517 Fisgard St Unit ##506 | 1 | 1 | 583 | $449,000 | $770 | 5 days |
| 770 Fisgard St Unit ##416 | 2 | 2 | 959 | $599,000 | $624 | 7 days |
| 1620 Camosun St | 8 | 6 | 4,725 | $1,275,000 | $269 | 10 days |
| 930 North Park St Unit ##104 | 2 | 1 | 902 | $499,000 | $553 | 11 days |
| 760 Johnson St Unit ##605 | 1 | 1 | 583 | $385,900 | $661 | 11 days |
| 1270 Johnson St Unit ##102 | 2 | 2 | 1,019 | $475,000 | $466 | 11 days |
| 848 Mason St Unit ##201 | 2 | 2 | 872 | $589,900 | $676 | 11 days |
| 409 Swift St Unit ##117 | 1 | 1 | 628 | $425,000 | $676 | 12 days |
| 2002 Chambers St | 5 | 3 | 2,352 | $999,000 | $424 | 12 days |
| 1215 Bay St Unit ##201 | 2 | 1 | 926 | $369,000 | $398 | 17 days |
| 760 Johnson St Unit ##PH 1501 | 3 | 2 | 1,403 | $1,425,000 | $1,015 | 19 days |
| 777 Herald St Unit ##1006 | 2 | 2 | 865 | $715,000 | $826 | 19 days |
| 770 Fisgard St Unit ##500 | 2 | 2 | 1,353 | $1,295,000 | $957 | 20 days |
| 832 Fisgard St Unit ##304 | 2 | 2 | 1,029 | $464,900 | $451 | 20 days |
| 848 Mason St Unit ##401 | 2 | 2 | 873 | $589,900 | $675 | 20 days |
| 515 Chatham St Unit ##310 | N/A | 1 | 385 | $339,000 | $880 | 24 days |
| 517 Fisgard St Unit ##516 | 1 | 1 | 525 | $449,900 | $856 | 24 days |
| 2310 Fernwood Rd | 2 | 2 | 1,149 | $784,900 | $683 | 24 days |
| 834 Johnson St Unit ##1106 | 1 | 1 | 720 | $525,000 | $729 | 25 days |
| 760 Johnson St Unit ##206 | 1 | 1 | 459 | $349,900 | $762 | 25 days |
| 777 Herald St Unit ##804 | 1 | 1 | 549 | $449,000 | $817 | 26 days |
| 834 Johnson St Unit ##404 | 1 | 1 | 512 | $339,900 | $663 | 27 days |
| 409 Swift St Unit ##119 | N/A | 1 | 360 | $319,000 | $886 | 27 days |
| 613 Herald St Unit ##202 | 1 | 1 | 506 | $389,000 | $768 | 26 days |
| 1407 Government St Unit ##302 | 3 | 2 | 1,556 | $975,000 | $626 | 26 days |
| 834 Johnson St Unit ##2 | 1 | 2 | 1,193 | $775,000 | $649 | 27 days |
| 517 Fisgard St Unit ##501 | 1 | 1 | 583 | $469,900 | $806 | 27 days |
| 777 Herald St Unit ##2405 | 3 | 2 | 1,251 | $1,399,000 | $1,118 | 27 days |
| 610 Johnson St Unit ##304 | 1 | 1 | 672 | $495,000 | $736 | 31 days |
| 1215 Queens Ave | 6 | 2 | 2,735 | $1,049,000 | $383 | 32 days |
| 947 Caledonia Ave Unit ##8 | 3 | 2 | 1,329 | $700,000 | $526 | 33 days |
| 845 Johnson St Unit ##1402 | 2 | 1 | 762 | $578,000 | $758 | 33 days |
| 845 Johnson St Unit ##1002 | 2 | 1 | 762 | $550,000 | $721 | 33 days |
| 1602 Quadra St Unit ##407 | 1 | 1 | 769 | $399,000 | $518 | 34 days |
| 528 Pandora Ave Unit ##416 | 1 | 1 | 582 | $465,000 | $798 | 35 days |
| 732 Cormorant St Unit ##605 | 2 | 2 | 1,273 | $739,000 | $580 | 35 days |
| 1622 Camosun St | 5 | 3 | 2,573 | $1,099,000 | $427 | 36 days |
| 1315 Gladstone Ave Unit ##3 | 2 | 2 | 1,179 | $699,900 | $593 | 38 days |
| 1335 Rudlin St | 4 | 3 | 2,379 | $699,000 | $293 | 38 days |
| 528 Pandora Ave Unit ##408 | 1 | 1 | 644 | $530,000 | $822 | 39 days |
| 1111 Caledonia Ave | 2 | 1 | 1,005 | $789,500 | $785 | 41 days |
| 1109 Caledonia Ave | 3 | 1 | 1,008 | $789,500 | $783 | 41 days |
| 517 Fisgard St Unit ##302 | 1 | 1 | 582 | $465,000 | $798 | 45 days |
| 1157 Princess Ave | 4 | 5 | 3,198 | $1,399,999 | $437 | 45 days |
| 515 Chatham St Unit ##306 | 1 | 1 | 481 | $419,900 | $872 | 45 days |
| 515 Chatham St Unit ##305 | 1 | 1 | 481 | $419,900 | $872 | 45 days |
| Average: | 2.2 | 1.7 | 1,130 | $675,774 | $698 | 82 days |
|
Viewing 1 - 50 of 111
Next
|
NOTE: MLS® property information is provided under copyright© by the Vancouver Island Real Estate Board and Victoria Real Estate Board. The information is from sources deemed reliable, but should not be relied upon without independent verification. This website may only be used by consumers for the purpose of locating and purchasing real estate. By registering on this website I/We consent to the collection, use and disclosure of personal information as described in our privacy policy.
The trademarks MLS®, Multiple Listing Service® and the associated logos are owned by The Canadian Real Estate Association (CREA) and identify the quality of services provided by real estate professionals who are members of CREA. Used under license.