Inventory by Asking-Price Range
Current view-acreage listings grouped by asking price.


Real Estate Company
Track current asking-price patterns, active inventory, price per square foot and market time for Greater Victoria acreage properties with significant ocean, mountain, valley, farmland or panoramic views.
Browse View Acreages All Acreage Homes Waterfront Acreages 5–10 Acre Properties
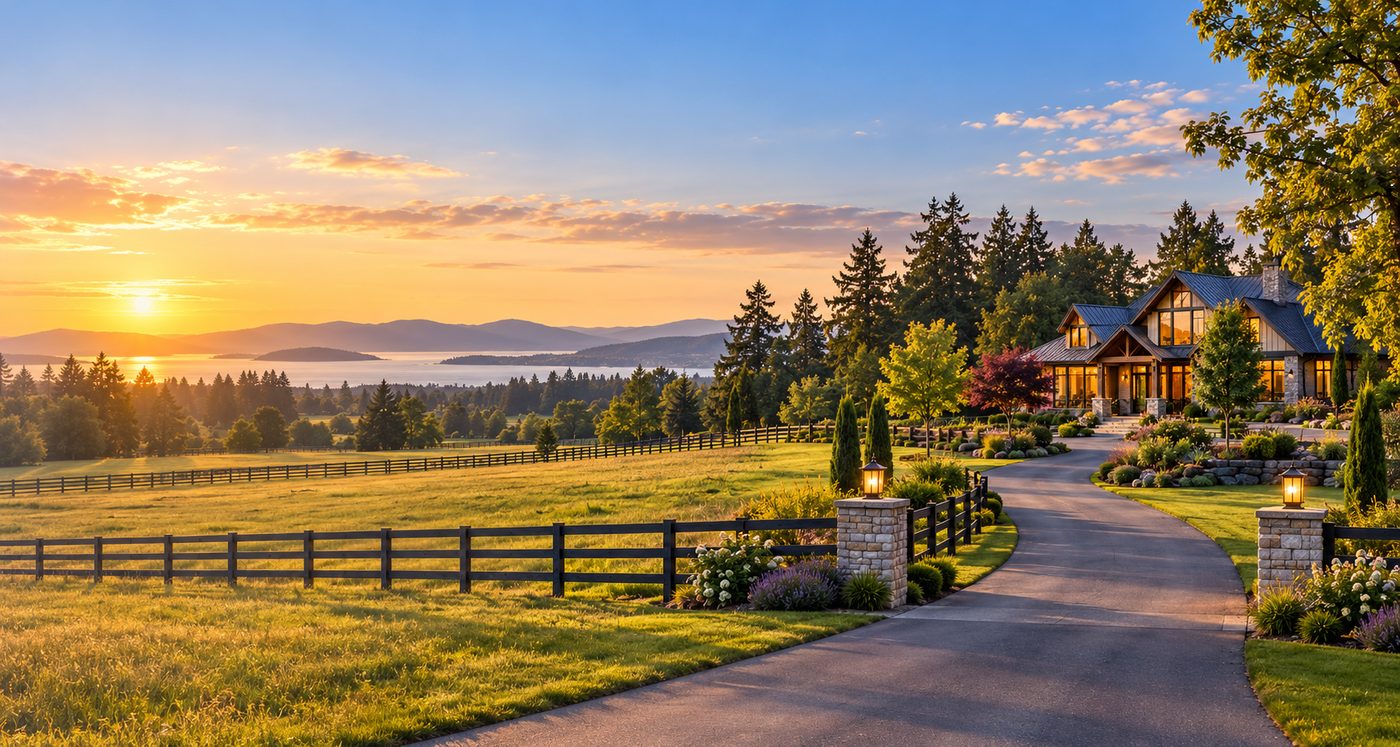
This report tracks the same active listing population as the Greater Victoria View Acreages search. Keeping the report and search population aligned ensures the live map statistics, charts and native listing data describe the same segment.
These charts summarize the active view-acreage inventory contained in the market-report table below. They show current asking-price distribution, market exposure and price-per-square-foot patterns rather than completed-sale statistics.
Current view-acreage listings grouped by asking price.
Current view-acreage listings grouped by market time.
Distribution of active listings with usable living-area data.
Each point compares one current asking price with days on market.
Charts represent current active listings only. View acreage inventory can include ocean-view estates, mountain-view properties, pastoral rural outlooks, elevated wooded sites and waterfront-influenced acreages. Changes in listing mix can therefore move averages materially. Price-per-square-foot analysis uses only records with usable living-area data.
View acreage values reflect both the land and the quality of the outlook. Orientation, permanence, privacy and site usability determine how strongly a view translates into market value.
Wide ocean or mountain panoramas may carry a different premium from partial or seasonal views. Trees, neighbouring land and future development can affect the outlook over time.
Sun, prevailing weather and wind exposure can materially affect an elevated acreage. Orientation should be considered with decks, patios, gardens and the home's main living areas.
Many strong-view sites are elevated or sloping. Buyers should compare actual usable land, driveway grades, drainage, rock and forest cover rather than relying on parcel size alone.
Wells, septic systems, private roads, workshops, barns, guest accommodation and estate improvements can materially affect both value and ownership cost.
Greater Victoria view acreages are not a uniform property class. A panoramic North Saanich estate, an elevated Highlands property, a pastoral Central Saanich acreage and an ocean-view holding in Sooke can all satisfy the view criteria while competing at very different prices.
Average asking price should therefore be interpreted together with the active listing mix. A few luxury estates, waterfront-influenced properties or exceptional panoramic sites can move the average without indicating an equivalent change in every view acreage.
Market time can also reflect specialization. Properties with a strong, permanent view, practical access and good usable land may appeal broadly, while steep, exposed or highly specialized sites may require a narrower buyer pool.
View acreage inventory varies by municipality because elevation, coastline, farmland, forest, servicing and commuting distance all shape the character and value of the properties available.
Ocean, Gulf Island and rural views can combine with estate homes, wooded acreage and equestrian properties close to Sidney, the airport and Swartz Bay.
Rural holdings can overlook farmland, Saanich Inlet and peninsula landscapes. Agricultural context, ALR status and usable land remain important alongside the view.
Elevated forest and mountain settings can offer strong privacy and long-range outlooks, but terrain, access, wells, septic systems and wind exposure deserve close attention.
Western areas can deliver dramatic ocean, mountain and wilderness views. Exposure, slope, rainfall, road access and distance from central Victoria can materially affect demand.
| Address | Beds | Baths | Living ft2 | List Price | Cost per ft2 | DOM |
|---|---|---|---|---|---|---|
| 123 Murrelet Pl | 4 | 3 | 3,000 | $1,798,000 | $599 | 0 days |
| 4809 Eales Rd | 3 | 6 | 7,606 | $5,599,000 | $736 | 4 days |
| 1 Dallas Rd Unit ##A4 | 1 | 1 | 734 | $249,900 | $340 | 4 days |
| 4328 Trans Canada Hwy | 4 | 3 | 3,348 | $1,325,000 | $395 | 4 days |
| 4916 Lochside Dr | 5 | 5 | 4,361 | $1,899,000 | $435 | 5 days |
| 4690 Otter Point Pl | 4 | 6 | 4,726 | $2,525,000 | $534 | 5 days |
| 8074 Mcphail Rd | 4 | 4 | 4,144 | $4,795,000 | $1,157 | 7 days |
| 8126 Brutus Ridge Rd | 3 | 2 | 1,805 | $1,199,900 | $664 | 7 days |
| 4014 Holland Ave | 4 | 4 | 1,877 | $1,290,000 | $687 | 7 days |
| 762 Memory Lane | 6 | 3 | 3,222 | $1,350,000 | $418 | 9 days |
| 2083 North End Rd | 3 | 3 | 2,229 | $1,140,000 | $511 | 10 days |
| 8508 Emard Terr | 5 | 3 | 2,509 | $1,375,000 | $548 | 11 days |
| 2766 Island View Rd | 3 | 2 | 1,673 | $1,279,900 | $765 | 11 days |
| 4218 Armadale Rd | N/A | N/A | 1,000 | $1,699,000 | $1,699 | 12 days |
| 3871 Cactus Pl | 4 | 3 | 4,309 | $3,499,999 | $812 | 12 days |
| 7000 Mays Rd | 5 | 4 | 3,845 | $2,699,900 | $702 | 13 days |
| 10814 Beach Rd | 6 | 5 | 6,068 | $16,000,000 | $2,636 | 13 days |
| 377 Seymour Hts | 7 | 8 | 7,324 | $9,850,000 | $1,344 | 17 days |
| Lot 2/9333 Invermuir Rd Unit ##Proposed | 4 | 1 | 1,705 | $1,849,000 | $1,084 | 17 days |
| 150 Liberty Hall Lane | 3 | 4 | 2,842 | $1,650,000 | $580 | 18 days |
| 2815 Otter Point Rd | 5 | 5 | 2,531 | $1,569,000 | $619 | 18 days |
| 1140 Boardman Lane | 6 | 4 | 7,053 | $5,000,000 | $708 | 19 days |
| 7995 West Coast Rd | 4 | 5 | 3,534 | $2,750,000 | $778 | 20 days |
| 9193 West Coast Rd | 5 | 6 | 4,615 | $2,349,000 | $508 | 20 days |
| 389 Moses Point Rd | 1 | 1 | 711 | $2,499,000 | $3,514 | 20 days |
| 11406 Sycamore Dr | 5 | 5 | 6,377 | $3,099,000 | $485 | 21 days |
| 202 Old Scott Rd | 3 | 3 | 3,362 | $4,495,000 | $1,337 | 25 days |
| 560 Wilderness Pl | 5 | 6 | 5,020 | $2,288,000 | $455 | 24 days |
| 1622 Millstream Rd | 5 | 4 | 3,202 | $1,669,000 | $521 | 24 days |
| 4890 Wilson Rd | 4 | 2 | 3,070 | $1,349,900 | $439 | 25 days |
| 755 Butterfield Rd | 5 | 6 | 3,749 | $2,900,000 | $773 | 25 days |
| 4537 Otter Point Rd | 7 | 6 | 2,699 | $1,799,900 | $666 | 25 days |
| 250 Holmes Rd | 4 | 5 | 6,409 | $4,980,000 | $777 | 25 days |
| 998 Gillespie Rd | 5 | 3 | 2,403 | $2,350,000 | $977 | 25 days |
| 800 Lower Ganges Rd | 4 | 4 | 6,501 | $4,480,000 | $689 | 25 days |
| 5209 Old West Saanich Rd | 7 | 5 | 5,014 | $3,495,000 | $697 | 26 days |
| 1183 Hillgrove Rd | 2 | 1 | 1,168 | $1,099,000 | $940 | 27 days |
| 4553 Cordova Bay Rd | 4 | 2 | 2,386 | $1,700,000 | $712 | 28 days |
| 4731 Mcvicker Rd | 3 | 2 | 1,737 | $975,000 | $561 | 28 days |
| 377 Evergreen Lane | 2 | 1 | 550 | $499,000 | $907 | 31 days |
| 165 Ontario Pl | 3 | 4 | 2,978 | $1,899,000 | $637 | 32 days |
| 649 Lost Lake Rd | 3 | 3 | 1,806 | $1,249,000 | $691 | 31 days |
| 976 Lands End Rd | 5 | 2 | 2,429 | $2,495,000 | $1,027 | 32 days |
| 2833 Woodcroft Pl | 4 | 4 | 4,318 | $2,799,900 | $648 | 32 days |
| 1809 Pritchard Rd | 4 | 3 | 3,843 | $2,149,000 | $559 | 32 days |
| 5000 Sooke Hanger Dr | 3 | 4 | 4,274 | $1,788,000 | $418 | 33 days |
| 37163 Galleon Way | 3 | 3 | 2,475 | $1,195,000 | $482 | 35 days |
| 6791 East Sooke Rd | 4 | 3 | 2,196 | $990,000 | $450 | 34 days |
| 370/400 Baker Rd | 1 | 1 | 937 | $3,500,000 | $3,735 | 35 days |
| 1081 Aspen Rd | 5 | 6 | 4,692 | $5,900,000 | $1,257 | 37 days |
| Average: | 4.2 | 3.9 | 3,785 | $3,148,320 | $25,297 | 105 days |
|
Viewing 1 - 50 of 194
Next
|
| Address | Beds | Baths | Living ft2 | List Price | Cost per ft2 | DOM |
|---|---|---|---|---|---|---|
| 960 Lands End End | 5 | 5 | 5,783 | $7,895,000 | $1,365 | 101 days |
| Average: | 5.0 | 5.0 | 5,783 | $7,895,000 | $1,365 | 101 days |
|
Viewing 1 - 1 of 1
|
NOTE: MLS® property information is provided under copyright© by the Vancouver Island Real Estate Board and Victoria Real Estate Board. The information is from sources deemed reliable, but should not be relied upon without independent verification. This website may only be used by consumers for the purpose of locating and purchasing real estate. By registering on this website I/We consent to the collection, use and disclosure of personal information as described in our privacy policy.
The trademarks MLS®, Multiple Listing Service® and the associated logos are owned by The Canadian Real Estate Association (CREA) and identify the quality of services provided by real estate professionals who are members of CREA. Used under license.